Ways of Working108
Agile Marketing Metrics

Jim Ewel
April 16, 2020
Jim Ewel
April 16, 2020
As Agile Marketers, we follow the dictum often attributed to W. Edwards Deming, “In God we trust. All others bring data.” This is reflected in the first value of the Agile Marketing Manifesto which says that we value “Validated learning over opinions and conventions.”
How do we track this data? An Agile Marketing dashboard can help ensure that everyone is on the same page and looking at the same numbers. The dashboard also reinforces what’s important – your values. Dashboards allow you to review trends and discover issues before they become problems.
So, which metrics should appear on our dashboards? Too much and no one pays attention. Too little and we miss important information. Here are a few thoughts about which metrics to include in your Agile Marketing dashboard.
One of the most important principles of business agility is to value outcomes over outputs. In other words, our focus should be on improving business outcomes with our marketing, not creating more advertising, more content, more promotional materials (outputs).
Often people are tempted to choose high level goals like revenue, sales, customer lifetime value, etc. for their outcome measures on their Agile Marketing dashboard. It can be difficult to measure marketing’s contribution to these high-level goals as other functions within the organization also contribute to these goals. Instead, I suggest that you measure specific customer behaviors and the intermediate outcomes that lead to high-level goals.
The classic example of an intermediate outcome is the Sales Qualified Lead (SQL). SQLs are the result of customer behaviors – someone downloads a whitepaper, they visit our website 3 times over the space of 2 weeks, they attend a webinar. We give each of these behaviors a score and if the score is high enough, we send an SQL over to sales. If you measure SQLs, this should probably be in the Outcomes section of your Agile Marketing Dashboard.
Be careful that your Outcomes aren’t “vanity metrics.” First defined by Eric Ries in his book The Lean Startup, vanity metrics make us feel good but do nothing to move the business forward. They don’t contribute to business outcomes. Table 1 shows a few examples of vanity metrics and some alternative metrics.
| Vanity Metric | Alternative Metric |
|---|---|
| Web impressions | Conversions |
| PR mentions | Additional traffic and leads attributable to PR |
| Social media followers | Additional traffic and leads attributable to social media |
| Net promoter score | Lower churn rate, additional repeat business |
| Brand awareness | Advanced multi-touch attribution data |
Table 1 – Vanity Metrics and Alternatives
Also be careful not to measure too many outcomes. I suggest measuring no more than 3 or 4 outcomes to start with. A small, focused number of metrics lets everyone know what’s important. Individual teams may have their own dashboards with their own outcomes, particularly if different teams work with different business units or brands.
Although it’s more important to measure customer behaviors and intermediate outcomes than ultimate outcomes like revenue and profitability, you still have to understand how these customer behaviors contribute to the ultimate outcomes. If you’re feeding the funnel with leads, for example, you’ll need to understand the ratio of those leads to sales and perhaps Customer Lifetime Value (CLV). These ratios and numbers like CLV may or may not appear on the dashboard, but you need the metrics to justify marketing spend.
Also make sure that your business units are on board from the beginning and involved in the choice of outcomes. The business units should be familiar with how the numbers are calculated. Let’s face it, other departments don’t always trust our numbers. They may be suspicious and skeptical that we manipulated the numbers. Transparency is your friend here.
Several years ago, at a meeting of the San Francisco Agile Marketing meetup, Sean Ellis showed a graph of how Twitter improved customer acquisition by increasing the number of exploratory and optimization tests per week they performed. As the number of tests went up, and the pace of their learning went up, so too did their most important metric: engaged users.
Sean said another thing that stuck with me: it’s not enough to simply tell the team to test more, you need to set specific goals for testing. If you’re only doing one test every two weeks, set a specific goal of doing 5 tests a week, then 10 tests a week, and so on.
Make sure that your dashboard has a section devoted to the number of tests you’re doing per week.
I know that I said that Agile Marketers value outcomes over outputs. That doesn’t mean that we don’t value efficiency and predictability, two benefits of measuring our throughput.
If your team is practicing Scrum, you should measure Story Points completed per Sprint (velocity) and show a graph of your velocity over time in your dashboard. Measuring velocity will help you understand (and be able to demonstrate to others) your increasing efficiency with Agile methods.
Also, if you’re practicing Scrum, you may want to measure the percent of work completed for each Sprint over time. Your goal should be to complete 90% or more of the Sprint backlog for each Sprint. If not, you’re overcommitting or being interrupted frequently with unplanned work.
If your team is practicing Kanban, measure throughput as the number of tasks completed per day or per week. Note that this is most effective if the relative size of each task is similar, or if the group of tasks that you do for a day or a week (whichever you measure) have a consistent average size.
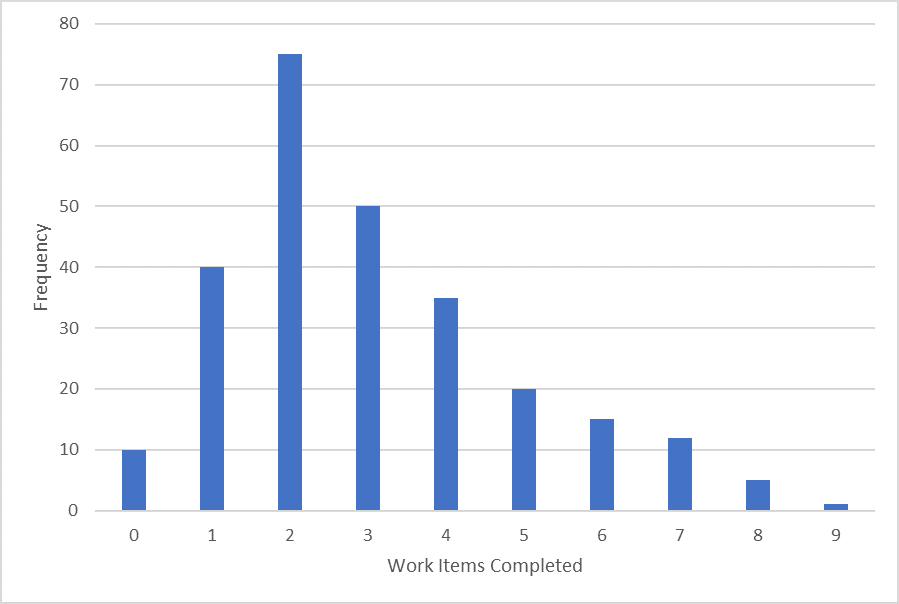
Teams practicing Kanban look for consistent throughput over time. One way to visualize this is by looking at a Throughput Histogram, which plots the number of items the team completes each day as a frequency chart. See Figure 1 for an example.

The Throughput Histogram can give you a visual representation of how many work items per day the team is completing. Just looking at the chart above, it looks like the team is completing between 2 and 3 items per day.
Your Agile Marketing dashboard may also include data to help you manage your backlog. Include a metric both on the size of the backlog over time, as well as the rate of arrival of new backlog items. Also include your average Cycle time as well as Lead time.
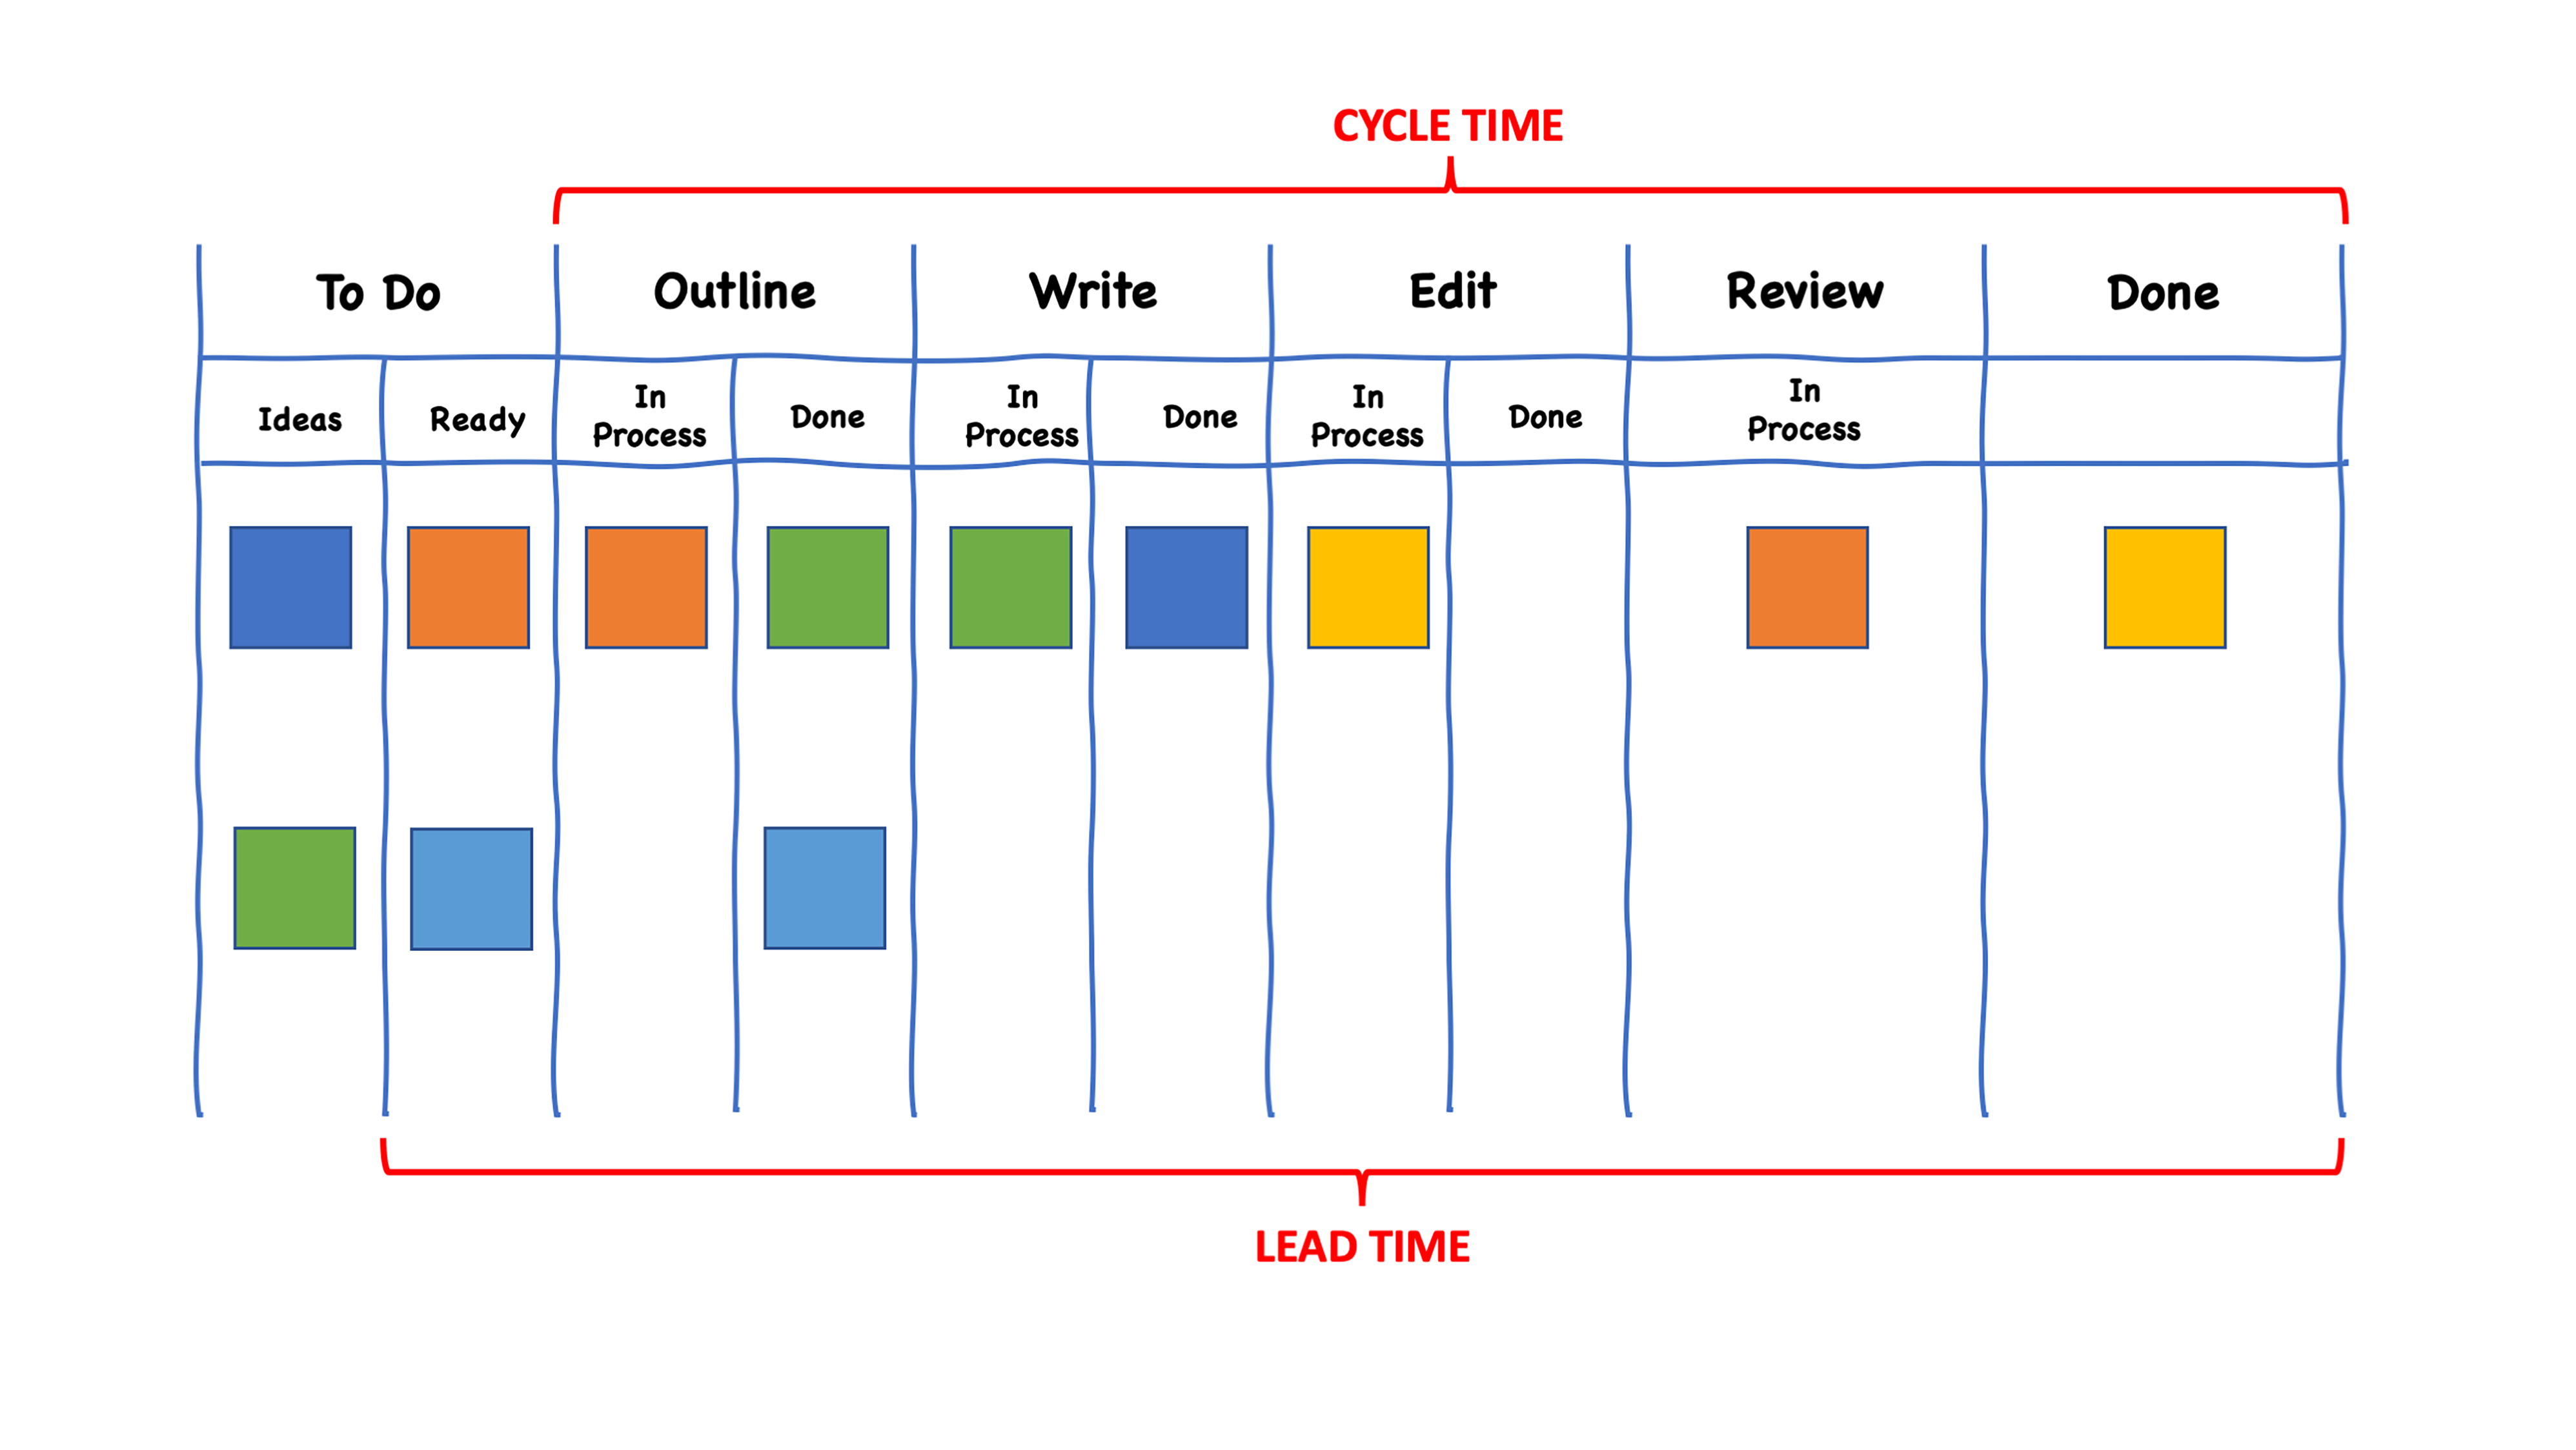
Cycle time is the time it takes to complete work once it is started. Lead time is the time, on average, it takes for work to be delivered once there is a commitment to do the work, including the time that it spends waiting in a queue for someone to start on it. See Figure 2 for an illustration of the difference between the two.
Low cycle times mean that your team is working efficiently. Low lead times keep your clients happy. Measure both. You can also look at a Cycle Time Histogram, which plots the number of work items completed by the Cycle Time in days.
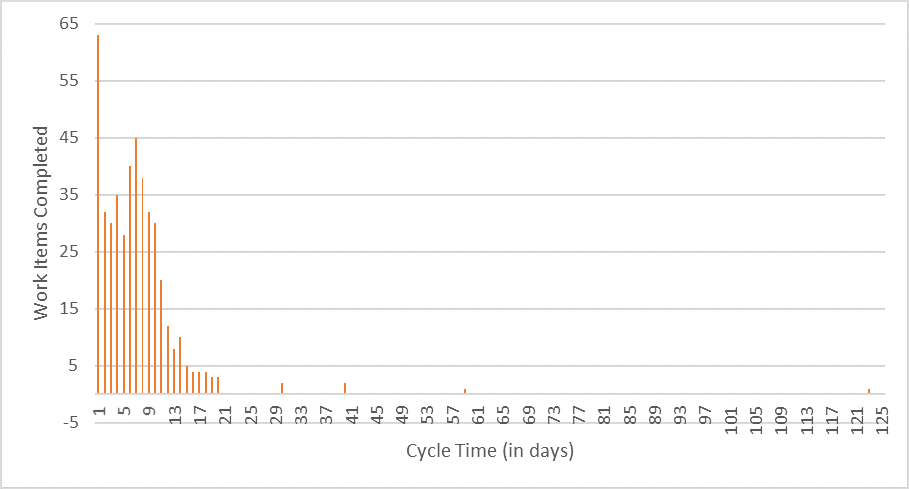
The cycle time histogram can be used to identify outliers (why did one item have a cycle time of 123 days?) and to predict future work item delivery times.
Also measure your team’s overall Work in Progress (WIP) at a given time. For example, in Figure 2, the overall WIP is 7 (7 colored boxes in progress). Lower overall WIP numbers indicate that you’re doing less multitasking. This is relative to team size. If you’re one person, having an overall WIP of 7 would mean that you’re juggling too much. If you’re a team of 7, no one is multitasking.
One of the banes of marketing teams is rework. This is particularly true for creative teams and content marketing teams. Some rework is to be expected. If each creative or content item gets reworked 1 or 2 times, that’s fine. If your average is somewhere above that, and I’ve seen numbers as high as 7 or 8, then you have a problem. Expectations aren’t being communicated, you have too many reviewers with different opinions, or the work delivered isn’t of sufficient quality. I recommend measuring the % of tasks requiring more than 1 rework, the average number of review cycles and the cumulative rework effort.
The second principle of Agile Marketing is Collaboration over Silos and Hierarchy. Collaboration is almost like Justice Potter Stewart’s definition of pornography: I know it when I see it. So how do we measure collaboration?
One resource that reviews a number of methods of measuring collaboration is provided by Broadleaf Consulting. The resources they list range from surveys to models for evaluating or increasing the amount of collaboration in an organization.
I suggest that organizations adopting Agile Marketing adopt some measure of collaboration. Make sure to establish a baseline before you embark. It may be as simple as a monthly survey, with 3-5 questions on the topics of communication, coordination, shared purpose, trust and joint decision-making. Combining these into a single composite score can be useful on an Agile Marketing Dashboard.
I asked several organizations I know that have been practicing Agile Marketing for some period of time whether they use a central dashboard, and if so, what they measure. My general finding is that most teams have not built formal dashboards, but they are measuring (and measured by) outcomes. A few are measuring throughput. No one I spoke to was measuring rework or collaboration.
Please subscribe and become a member to access the entire Business Agility Library without restriction.